
I’m seeing a lot of posts about high resolution and people switching DSPs for models with ever increasing sample rates and bit depth… I also see this graphic everywhere and It’s misleading because it suggests that the smooth wave of an analog signal is somehow turned into a choppy-looking thing that must sound bad. So, here’s how this works

Years ago, a guy named Harry Nyquist developed a theorem upon which digital audio is based. His theorem states that for any periodic signal (a sine wave), the shape of the wave can be accurately described by only two points along that wave.

Here’s how that works. On the left is a sine wave and two red dots. These two red dots correspond to points on the wave. On the right is a higher frequency sine wave and the two dots that are at the same points in time do not correspond to points on the wave. In order to describe the higher frequency sine wave, the placement of the left dot would have to change and that would be a different sine wave.

So, two points describe the frequency of the wave and two other points describe the frequency of a different wave. Now, let’s say we have a sample rate of 44.1k, like a CD. Since it takes two points to determine the frequency of a sine wave, the highest frequency sine wave we can describe is half of that (2 dots), or 22.05kHz. We hear as high as 20k. So, 22.05kHz is actually higher than we can hear. Here’s a 20kHz wave. The green dots are the samples. This is from adobe audition.

Now, With the same sample rate, this is a 20Hz wave. Hey! I can’t see the dots! That’s because there are so many, that there aren’t enough pixels to display them in the adobe audition software. Here’s what it looks like if I zoom in.

So, if it takes only two, then I have lots of extra dots that are unnecessary. If you remember some geometry from high school, then you remember that two points in space define a line. If you know the two points, you can draw a line between them. This works the same way. The line is the same whether there are two points on the line or 50,000 points. It’s still a line. Same here. Two points is a sine wave. 50,000 points on the same sine wave is still the same sine wave. The difference? The amount of data used to describe the wave (50,000 points is more data than 2 points). And that’s why this is misleading:
OK, so sample rate determines the highest frequency that can be accurately reproduced by our two dots and more than two dots is a waste, thanks to Harry Nyquist. A sample rate of 96kHz can reproduce up to 48kHz. More than twice as high as we can hear. Huh? But the additional dots for lower frequencies are of no benefit.
The second thing to consider is bit depth. CD quality is 44.1k/16 bit. That means it can accurately define the frequency of a signal up to about 22kHz. What’s the 16? What’s 16 bits? Bit depth determines the resolution of the level of the signal.

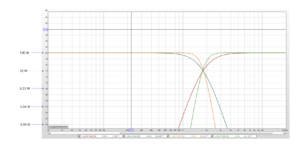
In the picture below, a 1kHz, 0dB (as loud as it can go) sine wave is shown. The green dots are the samples, evenly spaced from left to right. The horizontal scale is time, so there’s a sample every 1/44,100 second. Bit depth determines the number of possible values from the top of the wave to the bottom of the wave that can be used to describe the LEVEL of the signal.
If we only had 4 bits, we’d have 16 possible level values at each sample and we’d have to choose the closest one. If one didn’t appear on the sine wave, we wouldn’t be able to describe it precisely. See the example below:

With 16 bits, there are 65,536 possible values for the red dots. That’s MUCH higher accuracy.

With 24 bit, there are MILLIONS of possible values. How much is necessary? If there’s no perfectly accurate value, then we have something called “quantization error”. That adds a miniscule amount of distortion and most modern ADC and DACs have stuff built in to minimize it. So, why does this matter and do higher values for bit depth really help us? The answer is, “Yes”, to a point. What if our signal isn’t as loud as it can be (0dB)? Below is that same sine wave attenuated by 20dB with the same 4 bit possibility. Now we’re kind of screwed because we only have about 2 possible values to describe the level of the wave. That means there’s a lot more distortion at low levels. But what if we had millions of values?

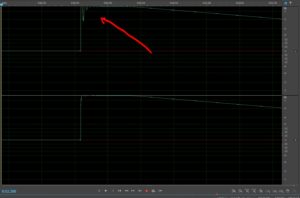
OK…but what about the DSP in my car? Your DSP has an analog to digital convertor inside. That ADC has a maximum input voltage. I’m using a pretty nice ADI model for this and it has a maximum input voltage of about 3V peak to peak. So, that’s 1.5 volts peak and about 1V RMS. That’s pretty standard. That means that whatever signal comes in is attenuated so it doesn’t clip the ADC. So now, we have all of that bit depth to describe a 1V RMS signal. Here’s what that looks like:

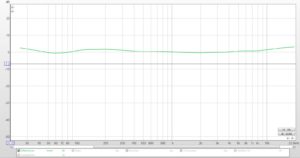
That means that the 16 bits can describe the voltage within .000045 volts. That’s pretty accurate. So…do you need a digital system that can reproduce signals higher than you can hear? And finally, this is what a pink noise signal looks like described in 16 bits at 44.1kHz. These dots accurately describe the noise. More dots means more data. That’s it.

So, the next time someone asks me how to get to Ralph’s down the street, instead of saying, go three blocks and turn left, maybe I’ll say, “Take one step south. Then, take another step south. Then, a third…then a 40,000th. Then, take one step west. Then another. Then another…then a 10,000th.” I’m sure the higher resolution of the instructions will be useful