
What’s the difference? I’ve always read and been told that “White noise is equal energy at every frequency and pink noise is equal energy in every octave”. What does that mean?
OK, white noise first. This is simple. In white noise, the signal is at the same level at every frequency (commonly from 20 Hz to 20kHz). That means that if there’s 1000 watts at 20 Hz, there’s also 1000 watts at 20 kHz. That’s a useful signal for some applications, but we rarely, if ever, use it when we’re working on, analyzing or tuning a car stereo.
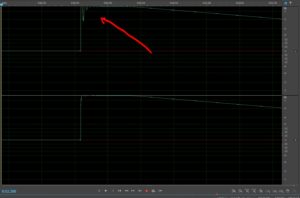
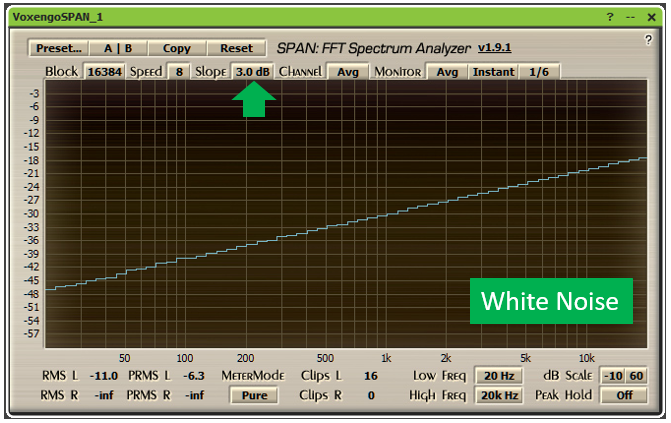
If we were to look at white noise on a spectrum analyzer, this is what we would see:
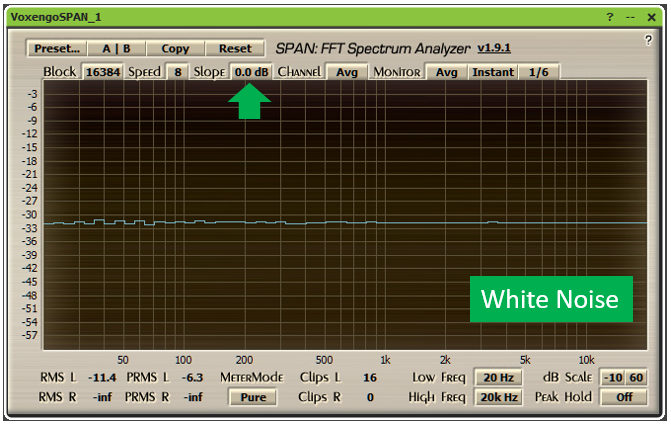
The spectrum analyzer I’m using for this tech tip includes a “Slope” function and I’ve highlighted that with a green arrow here. In this setting, the analyzer will display the level of the noise signal exactly as the signal is presented at its input. If there’s 1000 watts at 20 Hz, and 1000 watts at 20 kHz and at every frequency in between, you’ll see a straight line.
If you were to listen to white noise, you’d hear a lot of high frequency, and not a lot of bass. Hmmm…but the output is the same at all frequencies. Shouldn’t I hear everything evenly? Well, no.
White noise- or a linear distribution of energy at all frequencies is a distribution that rarely occurs in nature and one that we rarely hear. As it turns out, another distribution of energy is more common and that’s the one we use for analysis—a logarithmic distribution. That’s pink noise.
Our ears are a series of bandpass filters with octave-to-octave transitions. Octaves are a log scale in which each octave contains twice as many frequencies as the octave that precedes it. The first (lowest octave) in the range of frequencies we hear is 20 Hz – 40 Hz. There are 20 frequencies in between. The next octave is 40 Hz – 80 Hz. There are 40 frequencies in that octave. This pattern continues all the way up to 20 kHz. The last octave is from 10 kHz to 20 kHz. There are 10,000 frequencies in between.
If you’d like to read more about this, Google “Harvey Fletcher”. It’s an interesting rabbit hole that may keep you occupied for hours. For the purposes of this tech tip, all of that information is unnecessary so long as we’re willing to accept the logarithmic nature of human hearing as fact.
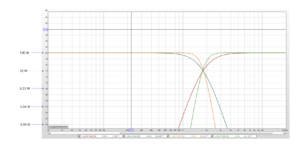
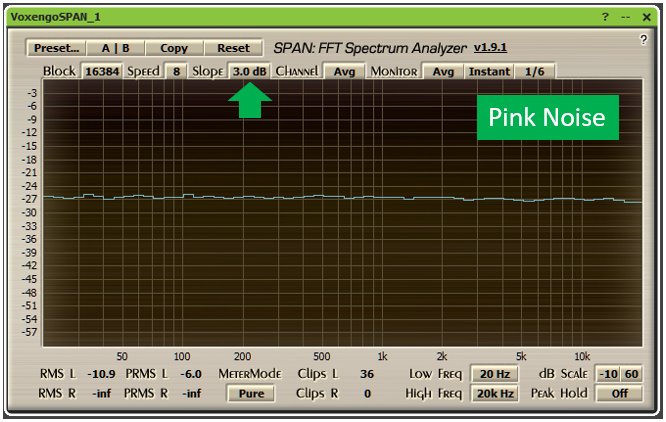
Pink noise is a distribution of energy across the spectrum of human hearing that is designed to sound equally loud from 20 Hz to 20 kHz. Pink noise sounds just as loud at 20 kHz as it does at 20 Hz. Since each octave is twice as wide as the octave that precedes it and the total energy in that octave is the same as the octave that precedes it, each subsequent frequency (from low to high) is a little lower in level. Below, the spectrum analyzer shows pink noise.

Hey! Wait a minute! When I view pink noise on my RTA, it shows a straight line. What gives?
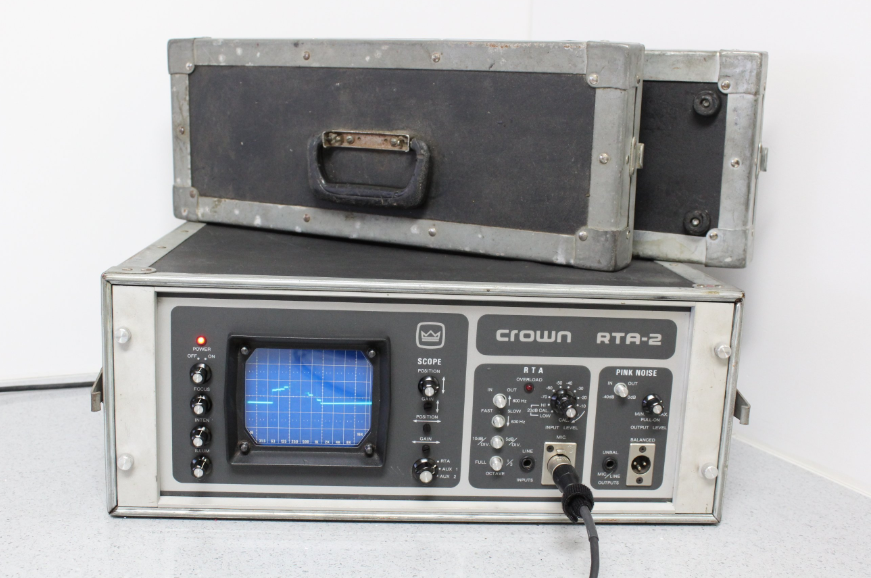
RTAs used for audio analysis are designed to show pink noise as a flat line. This is helpful for us when we analyze systems because our ears hear pink noise as a flat line. Originally, analog real time analyzers like an Audio Control 3050A used a series of 31 analog band pass filters to determine the level of the signal in each of those octaves, and that level would be represented by three LEDs–three per octave for 1/3 octave analysis. The gain of each of the filters was adjusted so pink noise would be displayed as a flat line. The first RTA I ever used was a Crown RTA-2. It also included a bank of bandpass filters but it displayed the frequency response using line segments on a CRT.
A “pinking filter” is simply a low pass filter with a slope of 3 dB per octave. So, if we apply that filter to white noise, we get pink noise. Why is it -3 dB? Because pink noise is equal energy in each octave and the energy is spread out over twice as many frequencies in each subsequent octave. 3 dB is a doubling or a halving of power.
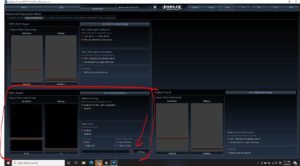
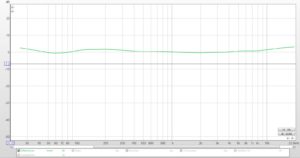
These days, we often use computers and computer programs as RTAs, so instead of a bank of analog filters that output to an LED, the RTA program just applies the inverse of that 3 dB per octave low pass filter so we’ll see pink noise as a flat line. In the spectrum analyzer I’m using for this tip, that can be applied as a slope. Below, I’ve applied that upward slope and our pink noise is displayed as a flat line.
That’s what we’re used to seeing on our RTA. If we were to view white noise on this display, this is what we’d see. Additionally, this is how we’d perceive white noise—lots of high frequency content and not much bass.
If we go back to viewing pink noise on a linear scale, something becomes obvious really quickly. There’s a lot less power at high frequencies than at low frequencies.
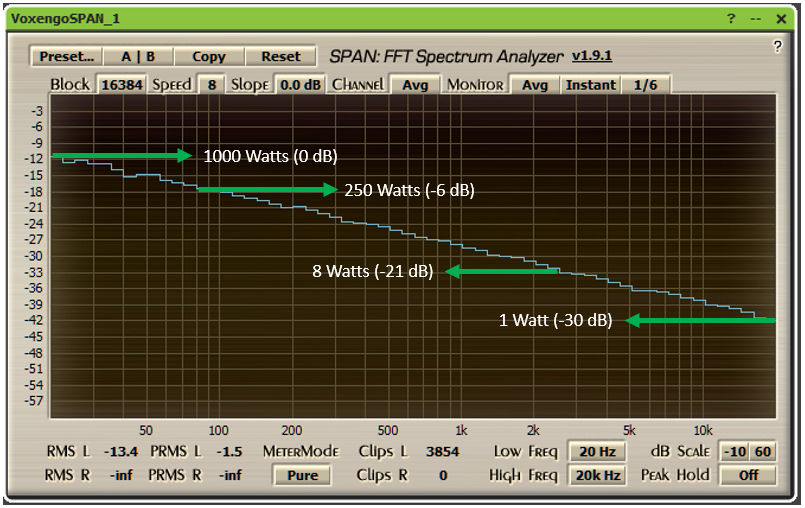
Let’s say we have a 3-way speaker system in which the sensitivity of the speakers are all the same—this will make the explanation a little easier. So, in our system, we have a 1000 watt amplifier. We’ve set the gain so that the amplifier makes 1000 watts at 20 Hz. In order for the system to reproduce pink noise accurately without clipping, the only frequency at which 1000 watts is necessary is at 20 Hz. At 40 Hz, only 500 watts are necessary. At 80 Hz, only 250 watts are necessary, and so on and so forth.
Since this is a 3-way system—a subwoofer, a midrange/midbass and a tweeter– the most power that the midrange, crossed over at 80 Hz, could possibly get in order to play pink noise accurately is 250 watts. The most power the tweeter would ever get, crossed over at 2.5 kHz is 8 watts.
Right. Eight watts. Just eight watts.
Hey wait! My tweeter is rated to handle 100 watts! What gives?
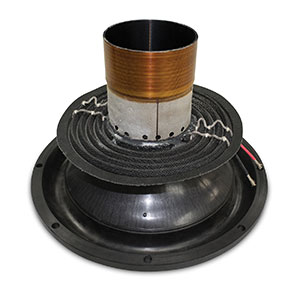
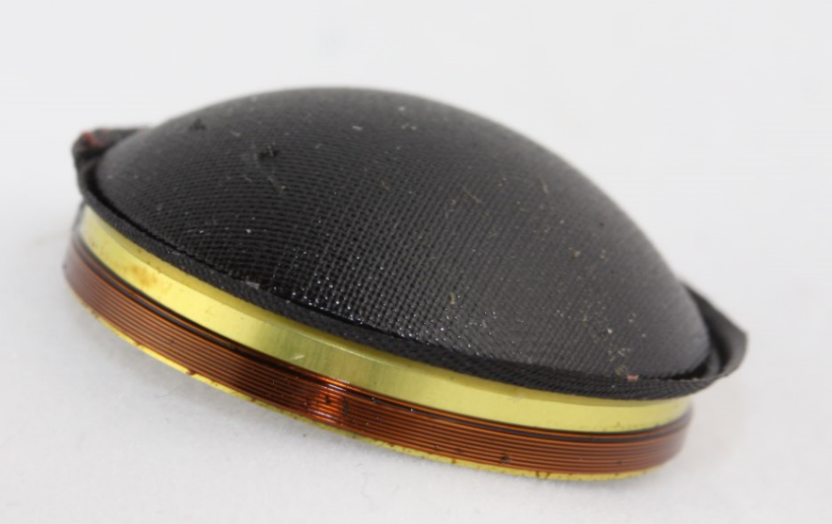
Below is a picture of a woofer’s voice coil and below that is a tweeter’s voice coil. Clearly, the woofer’s coil is able to dissipate a lot more heat. Something is up here.
Power testing for speakers is often performed with the speakers playing pink noise (or some other similar noise shape). The test is calibrated so that the highest level of the pink noise is set for the test as a reference voltage (or power). Then, that noise is played over the speakers for some period of time to see if the speaker will “handle” it without the coil burning up. For testing tweeters and midrange speakers, a high pass filter is used. That filter can be passive (in the case of a component system) or it can be applied to the noise after the level calibration.
So, your 100 watt tweeter is designed to handle 100 watts in a system in which it will reproduce only the highest frequencies in the signal. Is this BS? No. If I hook up a 100 watt amplifier to my tweeters and apply the correct high pass filter, the tweeter, rated to handle 100 watts will work just fine.
Pink noise is used for this test because it has a power distribution similar to music. Below, I’ve measured the frequency response of one of the EDM tracks on the Audiofrog UMI-1 Tuning CD.

Wow. Even less power makes it to the midrange and the tweeter when this EDM track is played, compared to pink noise.
Next, I’ve done the same thing to a jazz recording on that same CD.

In the jazz recording, the tweeters and the midrange get a lot more power, relative to the bass. What does this mean? For starters, the EDM recording is far less likely to destroy speakers in a properly tuned system than the jazz recording. In practice, however, the EDM recording is probably more likely to be played at a higher level than the jazz recording.
A note before we go any further: For the purposes of the graphs above and in the interest of simplicity, we haven’t considered the kind of crossovers we’ve used. Let’s say we’re using Linkwitz-Riley 4th order (24dB/octave). That means that in the graph above, for example, the actual power at 80 Hz that’s sent to both the midrange and the subwoofer would be 24 dB lower! -24 dB is 1/250 watts. Your speakers get even less power than this suggests.
So, what does all of this mean for choosing amplifiers and setting gain controls? We’ll save that for the next tech tip. I need to make some more graphics to explain that. I’ll give you some hints, though:
1. You don’t need a 150 watt per channel amplifier for your tweeters and using one may seriously degrade the noise performance of your system.
2. Amplifier clipping isn’t a midrange or tweeter destroyer, but in an improperly tuned system, head unit or processor clipping may be.
3. Setting the levels of the amplifiers that drive your midbass, midrange and tweeters using a sine wave track and a scope is a colossal waste of time and may put your speakers in more danger than is necessary!
4. Finally, setting all of the gains with a sine wave track and a scope without properly tuning the acoustic response is even more deadly to your speakers than setting those gain controls by ear.
Now, I need to go mow the lawn.